Does Berkeley have any targets for parks: how much park space residents should have, or how close it should be? The most common way to put a number on it is acres of parkland per 1,000 residents, and you'll sometimes hear that Berkeley should have 2. I went looking for whether that's actually a City target, where it comes from, how you'd calculate it, and what other cities do.
How do you count it?
Park acres divided by population sounds simple, but the result can vary widely depending on what you count as park.
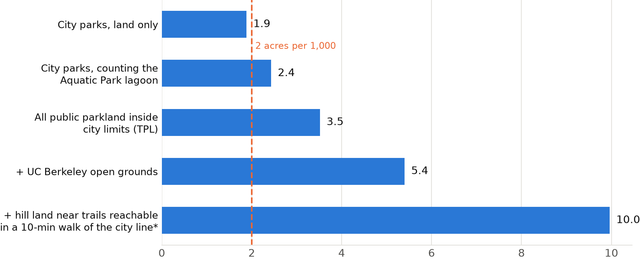
One city, five answersBerkeley acres per 1,000 residents, depending on what you count (2020 census).
*Hill land within 100 m of trails reachable within ~800 m of the city line. A 50 m buffer gives 8.8.
The biggest single swing in Berkeley is the Aquatic Park lagoon. The City's Aquatic Park page lists 32.76 land acres and 67.7 water acres and calls it a "100-acre park." Counting land only, City parks come to about 234 acres, or 1.9 per 1,000 residents. Counting the lagoon, it's about 302 acres, or 2.4.
I'd count it. The lagoon is a big part of what makes Aquatic Park appealing: it's beautiful, and it's busy with rowing, paddling and water-skiing. National guidance agrees. The Trust for Public Land and the National Recreation and Park Association's counting notes say "lakes and ponds that are completely enclosed by a park can have their full acreage counted" as long as they're open for recreation. Practice varies, though. San Francisco's park inventory counts Lake Merced, while Oakland's reported total looks like it leaves out Lake Merritt. Berkeley's own historical counts, below, were land-only.
Ownership matters too. Counting all public parkland inside the city, not just City parks, adds Berkeley's part of Eastshore State Park. That's how the Trust for Public Land (TPL) counts, and it gets 437 acres, or 3.5 per 1,000. School playgrounds and UC's open grounds are open space in a real sense as well. And Tilden and Claremont Canyon, which sit just past the city line, count for zero even though thousands of Berkeley residents use them. I wrote about those in an earlier post.
What Berkeley has had in the past
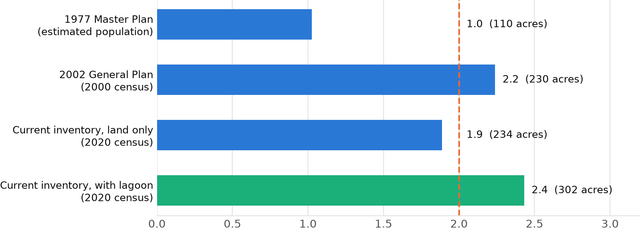
The 2-acre figure goes back to Berkeley's 1977 Master Plan. The City's 2002 General Plan reports that it was met:
"Berkeley has more than doubled its total parks acreage, from 110 to 230 total acres since 1977. As a result, the community achieved its 1977 Master Plan goal of two park acres per 1,000 people."
That 230 acres is close to today's land-only total, so it almost certainly didn't include the lagoon. In the same paragraph, the plan also counts the regional parks, and says that with Eastshore, the Bay Trail and Tilden, "the acres of parkland available to city residents increases to over 10 acres per 1,000 residents."
Berkeley's city parks per 1,000 residents
Acreage from the 2002 General Plan and the City's current park list. 1977 population interpolated from the 1970 and 1980 censuses.
Since then, City park acreage has been basically flat while the population grew about 20%. Counting the lagoon, City parks are at about 2.4 acres per 1,000 today. On the land-only count the City used in 2002, the ratio has slipped just under 2. But the General Plan never adopted 2 acres as a goal going forward. It mentions the number once, as a past goal that was met, and none of its open space policies sets a ratio. Those policies are about maintaining and improving the parks Berkeley has and adding space where people are underserved.
What Berkeley has today
The 2-acre figure does survive in one place: Measure L, the 1986 voter initiative that protects City parks and open space (I wrote about it in the Allston Way post). BMC 6.42.020(C) says census tracts with "less than the master plan provision of two acres of parks and open space per one thousand population shall be singled out as having a high priority for funding."
So the standard is in force, but neighborhood by neighborhood, as a way of steering park money to the places that have the least. It counts City parks, public school playgrounds and vacant public land, and says nothing about water.
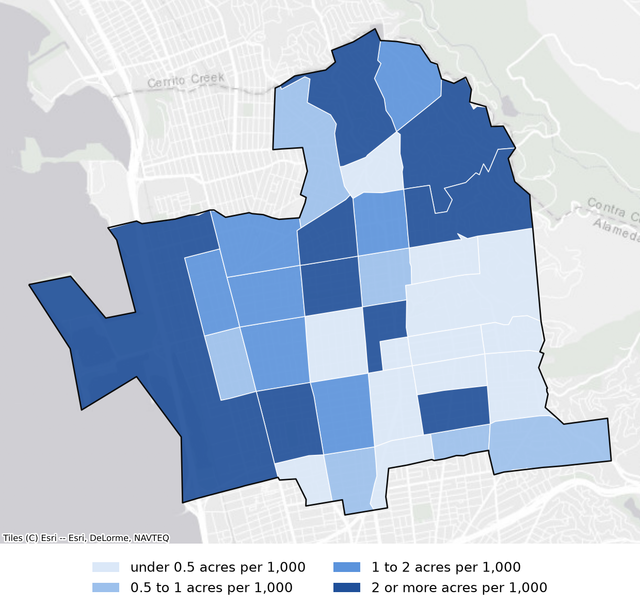
Parks and schoolyards per 1,000 residents, by census tract25 of 34 tracts, home to 75% of residents, are under 2 acres per 1,000.
By a rough version of that test, most of Berkeley falls short. Counting City parks and Berkeley Unified school grounds (I couldn't map vacant public land), 25 of 34 tracts are under 2 acres per 1,000, and they're home to about 75% of residents. The exception is the waterfront tract with Aquatic Park, Cesar Chavez Park and the Marina, at about 46 acres per 1,000. Berkeley's biggest parks are on its edge, and most people live inland. A citywide average doesn't show that, and the per-tract rule does.
Berkeley also has a rule for new subdivisions, BMC 21.36.060. It's the City's version of the state Quimby Act, which lets cities ask subdivisions for park land or fees. Berkeley's version asks for "in no case less than three acres of park area per thousand persons nor more than five acres" of the subdivision's future residents. In practice it rarely comes into play. It applies only when land is divided into lots or condos, and most new housing here is rental apartments, which don't need a subdivision map. Berkeley has no separate park impact fee.
What other cities do
City
Target
Status
Oakland
10 acres total and 4 "local-serving" per 1,000, plus a park within ¼ mile in the flatlands (OSCAR Element, 1996). "The City's goal, not a regulatory requirement."
4.2 City-owned and 6.9 total per 1,000 (2021 analysis)
Albany
3 acres of active parkland per 1,000 by 2035, "an aspirational target" (General Plan)
2.3 active; 7.2 counting the Albany Bulb and other passive open space (2015)
Emeryville
3 acres per 1,000 new residents, plus a park within a five-minute walk of every home (General Plan)
1.6 per 1,000 (2008)
Berkeley
No citywide ratio. 2 acres per 1,000 per census tract, for funding priority (Measure L)
2.4 for City parks, counting the lagoon; 96% of residents within a 10-minute walk of a park (TPL)
None of these cities treats a citywide ratio as a hard rule. Where ratios exist, they mostly serve as the basis for park fees on new development, and they're usually paired with a distance standard, which San Francisco relies on entirely. Definitions also vary a lot: Albany's split between "active" and "passive" parkland is the difference between 2.3 and 7.2.
What about "3 acres per 1,000"?
You'll also hear 3 acres per 1,000, sometimes with the claim that falling below it makes a city "critically underserved." That number comes from two state laws, and neither one sets a target for a city. The Quimby Act (Gov. Code §66477) caps what a city can ask a new subdivision to provide for parks. The 2008 state park grant law (Pub. Res. Code §5642) uses less than 3 acres of "usable parkland" per 1,000 residents as one way a community can qualify as "critically underserved," which helps decide who can apply for grants. The State measures that within a half mile of a specific project site, counting park land from all owners (Community FactFinder).
The law doesn't define "usable parkland." In practice the State counts publicly owned parks and recreational open space within a half mile of the project site, whoever owns it, and the acreage can include water inside parks. By that test the area around Aquatic Park is far over 3, and most of inland Berkeley is under it. I go into how it works in a separate post.
Quantity vs. quality
A ratio counts acres. It doesn't say whether those acres are close to where people live, whether they're usable, or whether they're well maintained. When a ratio is the headline number, debates tend to focus on protecting or adding acreage rather than on how well the parks serve people. Other measures point at those things directly: how many people live within a 10-minute walk of a park (in Berkeley, 96%), which neighborhoods have the least, and the condition and use of the parks themselves.
Should Berkeley have a citywide ratio?
I don't think so, at least not as a fixed target. The biggest problem is that a fixed ratio puts park goals at odds with housing goals. Berkeley is landlocked and almost fully built out, so its park acreage barely changes, and every new resident pushes the ratio down. Under its state housing targets, the City is planning for at least 8,934 new homes by 2031. That's roughly 20,000 more people, which would take City parks from about 2.4 acres per 1,000 to about 2.1, and continued growth after that would push it under 2. Keeping up would mean adding park land in a city with almost no vacant land. Under a fixed ratio, every new home counts against the park goal. If you care about housing, it's a poor way to set goals for parks.
A citywide ratio would also treat the city as one number when the real gaps are neighborhood by neighborhood, and it would put the emphasis on quantity over quality. What Berkeley already has is closer to right: a per-neighborhood rule for steering money, and near-universal walking access.
The secretary of Berkeley's Parks, Recreation and Waterfront Commission says the City does have a 2-acre target, from the 1977 plan. But the current General Plan says otherwise. Its introduction says the General Plan "replaces the 1977 Master Plan," and that "this Plan supersedes the 1977 Master Plan." So the 1977 plan's goal isn't in force on its own. The 2-acre number does still apply through Measure L, but neighborhood by neighborhood rather than citywide.
He also confirms that the Parks Department counts the Aquatic Park lagoon when it calculates the 2-acre ratio internally. That matches how I count it in the post, which puts City parks at about 2.4 acres per 1,000.
Methods and sources
How I calculated it
City parks, 1.9 and 2.4 per 1,000. The City's park pages list 234.5 acres of land. Aquatic Park is listed as 32.76 land acres plus 67.7 water acres; the 2.4 figure adds the water. Both are divided by the 2020 census population.
All public parkland inside city limits, 3.5 per 1,000. TPL's ParkServe count (May 2026). It still includes People's Park (2.7 acres), where UC is now building housing.
Adding hill land within a 10-minute walk, 10.0 per 1,000 in total. Counts hill land within 100 meters of trails reachable within a 10-minute walk (about 800 meters) of the city line. With a 50-meter buffer it's 8.8 per 1,000.
1977 and 2002 ratios. Acreage from the 2002 General Plan. I divided the 2002 figure by the 2000 census population, and the 1977 figure by a population interpolated between the 1970 and 1980 censuses.
Tract map. 2020 census tracts and their official 2020 populations, City park outlines from ParkServe (with the lagoon), and Berkeley Unified school grounds from OpenStreetMap, minus buildings. That approximates Measure L's inventory: school grounds are more than playgrounds, and vacant public land isn't included.