How much park does Berkeley have? Counting acreage, access, and the hills
How much park does Berkeley have? The answer depends a lot on what you count, and the common ways of measuring it give very different results for the same city. This post walks through the numbers: what the usual yardsticks are, what Berkeley looks like under each, and how it compares to its neighbors.
The yardsticks
The most common measure is acres of parkland per 1,000 residents. You'll see a figure of 3 acres per 1,000 come up in California, and it comes from two places in state law:
- The Quimby Act (Gov. Code §66477) lets a city require land or fees for parks when land is subdivided. It caps what a city can ask for at "three acres of park area per 1,000 persons residing within a subdivision." It's a limit on what a new subdivision can be charged, not a standard the city has to meet.
- The Statewide Park Development and Community Revitalization Act of 2008 (Pub. Res. Code §5642) funds a competitive grant program for new parks. A "critically underserved community" qualifies if it "has less than three acres of usable parkland per 1,000 residents," or if it's a disadvantaged (low-income) community without enough park space. The State applies this around a specific proposed project, using the parkland within a half mile of the site (Community FactFinder), not as a citywide average. The Act doesn't define "usable parkland."
Berkeley has its own figure too. The City's Open Space and Recreation Element of the General Plan (2002) says the City grew its parks from 110 to 230 acres after 1977 and "achieved its 1977 Master Plan goal of two park acres per 1,000 people." The same document counts the regional parks too: with the Bay Trail, Eastshore State Park, and Tilden, "the acres of parkland available to city residents increases to over 10 acres per 1,000 residents," and to over 12 with Claremont Canyon.
Nationally, the NRPA reports that the typical park agency has about 10 acres per 1,000 residents, with the caveat that "what works well for one agency may not be best for all."
Acreage ratios have real limits. They don't tell you whether a park is close to the people who would use it, and they don't capture quality at all. A newer approach is the Trust for Public Land's ParkScore, which also measures how many residents live within a 10-minute walk of a park, using actual walking routes around barriers like freeways and rail lines. TPL is upfront that "park quality is impossible to measure objectively."
Berkeley by the numbers
Counting step by step (2020 census population, 124,321):
| What's counted | Acres | Acres per 1,000 |
|---|---|---|
| City-owned parks | 273 | 2.2 |
| All public parkland inside city limits (TPL's count, incl. Eastshore State Park) | 437 | 3.5 |
| + UC Berkeley's open grounds | 671 | 5.4 |
| + hill parkland within a 10-min walk of the city line | 1,238 | 10.0 |
| + hill parkland within a 10-min walk of a bus stop | 1,515 | 12.2 |
| + hill parkland within a 10-min walk of parking | 2,550 | 20.5 |
And on access: 95.8% of Berkeley residents live within a 10-minute walk of a park, per TPL. Nationally, among the 100 largest cities, it's 76%.
A few notes on what's in each row:
- Inside city limits is TPL's figure, 6.6% of the city's land. Most of it is on the waterfront: Berkeley's part of Eastshore State Park, Aquatic Park, and Cesar Chavez Park are about 340 of the 437 acres.
- UC's open grounds are the campus minus buildings, parking, roads, the national lab, the Botanical Garden (which charges admission), and fenced athletic facilities. It isn't a park, but it's open to the public and works like one.
- Hill parkland is Tilden, Claremont Canyon, the UC land along the fire trails, and Grizzly Peak Open Space, about 2,800 acres in total, all just outside the city line. None of it counts toward Berkeley in TPL's numbers. The rows above count only the part within 100 meters of a trail you can reach in a 10-minute walk from the city line, a bus stop, or a parking lot.
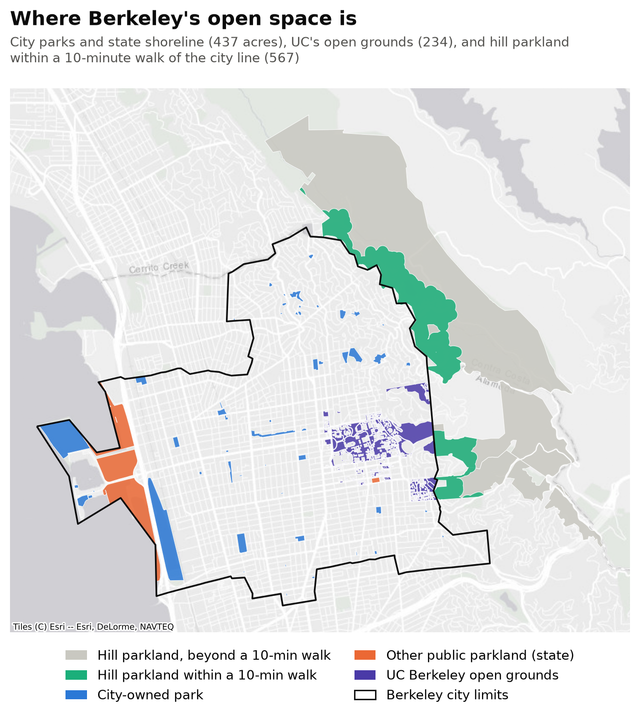
One caveat on the hills: they're hard to get to from the flats without a car, which is why the table shows walking, bus, and driving separately.
Comparing cities
Here's how Berkeley compares to its neighbors on TPL's numbers (parkland inside city limits only):
| City | Park acres | Share of land | Acres per 1,000 | Within a 10-min walk |
|---|---|---|---|---|
| Berkeley | 437 | 6.6% | 3.5 | 95.8% |
| Emeryville | 34 | 4.2% | 2.5 | 94.1% |
| Albany | 111 | 9.8% | 5.6 | 99.7% |
| San Francisco | 6,361 | 21.3% | 7.6 | 99.9% |
| Oakland | 4,189 | 11.8% | 9.5 | 88.0% |
These comparisons are harder than they look, because a city's number depends heavily on whether one or two big parks happen to fall inside its boundary:
- Albany's 111 acres are mostly the Albany Bulb and the rest of Albany's part of Eastshore State Park (66 acres) plus Albany Hill (18).
- San Francisco's largest park, the Presidio, is about 1,300 acres on its own.
- Oakland's two largest city parks, Knowland and Joaquin Miller, are about 900 acres together, both in the hills. Oakland has more acres per person than Berkeley, but fewer residents within a walk of a park, and TPL finds that Oakland's low-income neighborhoods have 85% less nearby park space than its high-income ones.
- Berkeley's biggest open spaces, Tilden and Claremont Canyon, sit just past the city line and count for zero.
None of this says anything about upkeep. Berkeley has one of the nicest park systems I've experienced. Oakland's parks, in my experience, are in noticeably worse shape.
Methods and sources
- State law: Gov. Code §66477 (Quimby Act), Pub. Res. Code §5642 and §5645 (2008 park grant act), and the State's Community FactFinder.
- Berkeley's goal: General Plan, Open Space and Recreation Element (adopted April 23, 2002).
- Population and land area: U.S. Census QuickFacts, 2020 census. City comparisons use TPL's population estimates.
- Park acreage and walking access: TPL's ParkServe dataset (May 2026), per-city statistics and park outlines. Berkeley on TPL's ParkServe map. TPL counts publicly accessible, park-like land from any owner, clipped to city limits, with water removed. ParkServe has a couple of quirks nearby: the UC fire-trail land is labeled "Berkeley Open Space," attributed to the City of Berkeley, and assigned to Oakland.
- Tilden: 2,079 acres per the East Bay Regional Park District; 2,093 in ParkServe's outline, which is the one used here.
- Walking analysis: OpenStreetMap data (a BBBike extract of the Berkeley area). For each hill park, I computed shortest walking routes along the trail and street network, starting from the Berkeley city line, from bus stops, or from roads and parking lots, and counted the park land within 100 meters of any trail reachable within 10 minutes (about 800 meters). With a tighter 50-meter corridor, the numbers drop by roughly a quarter. OpenStreetMap's trail mapping is good in Tilden but not perfect.
- UC open grounds: UC Berkeley's campus outline from OpenStreetMap, inside city limits, minus building footprints, parking, roads, Lawrence Berkeley National Laboratory, the Botanical Garden, and stadiums, tracks, and fields.